Geo Bee Geospatial
2024
scope
Web App Design Information Architecture Data Visualization for Binus University
deliverable
Wireframe Dashboard UI Product Page Data Visualization Guidelines
duration
3 Weeks

Goals
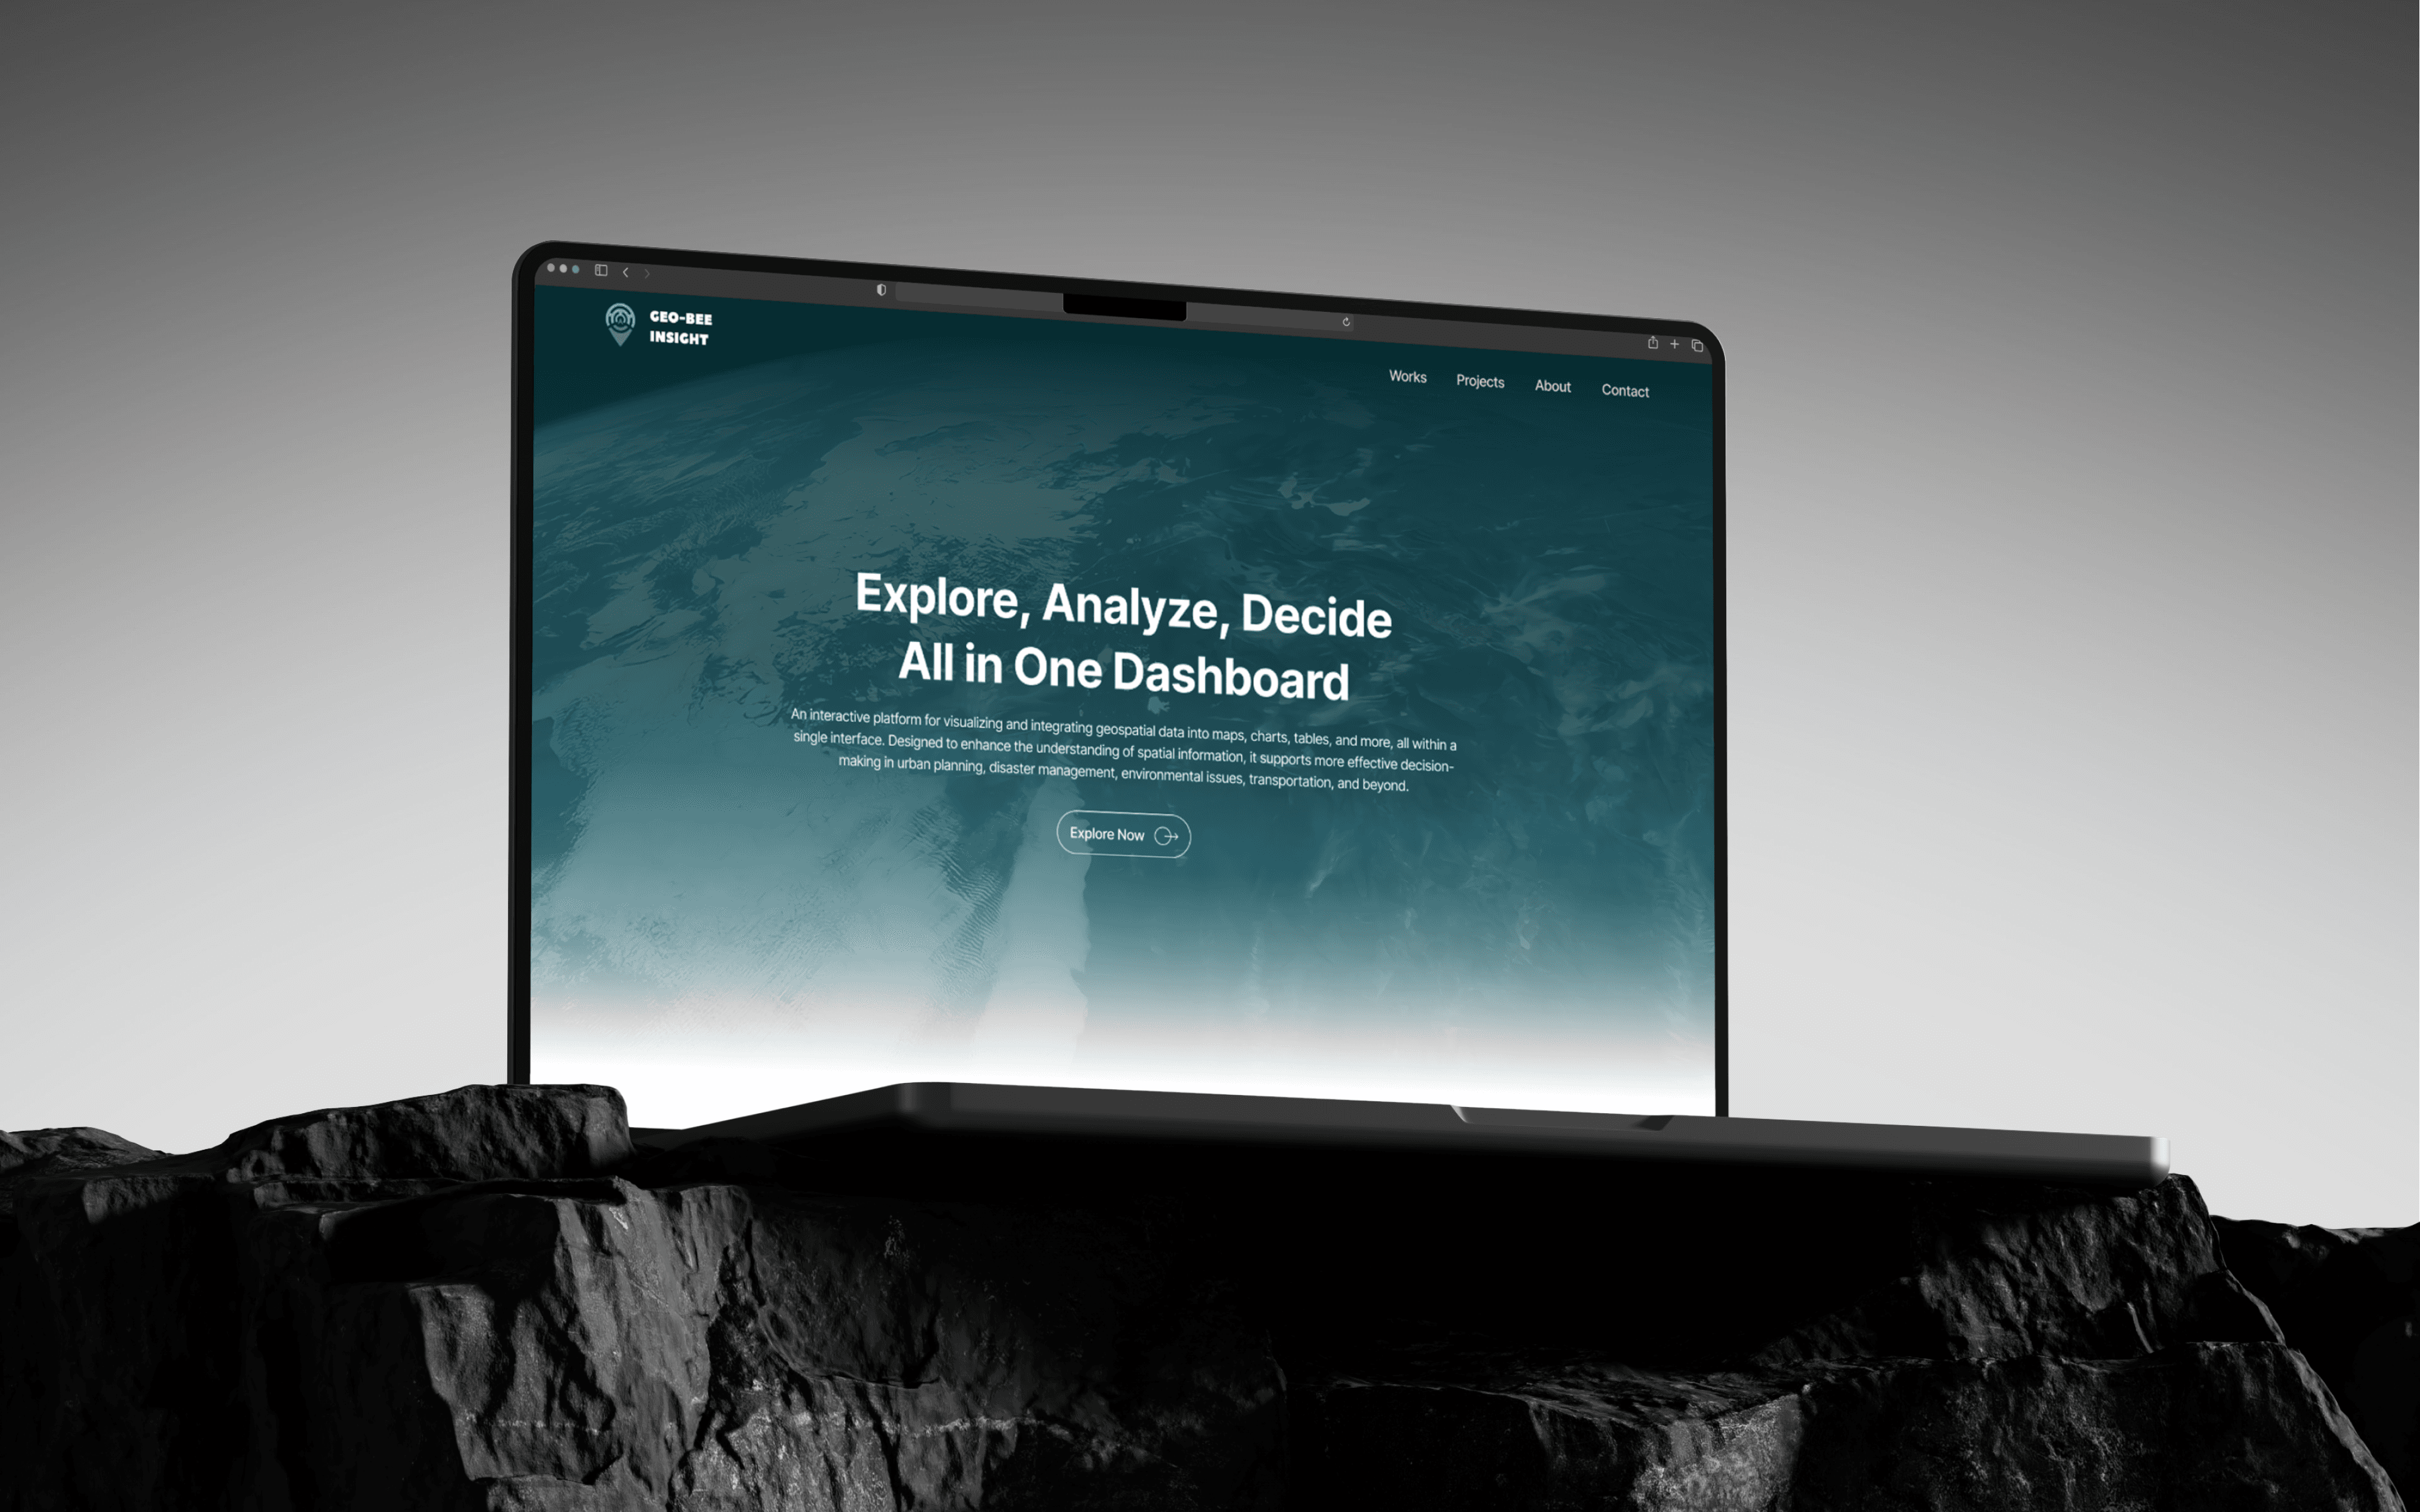
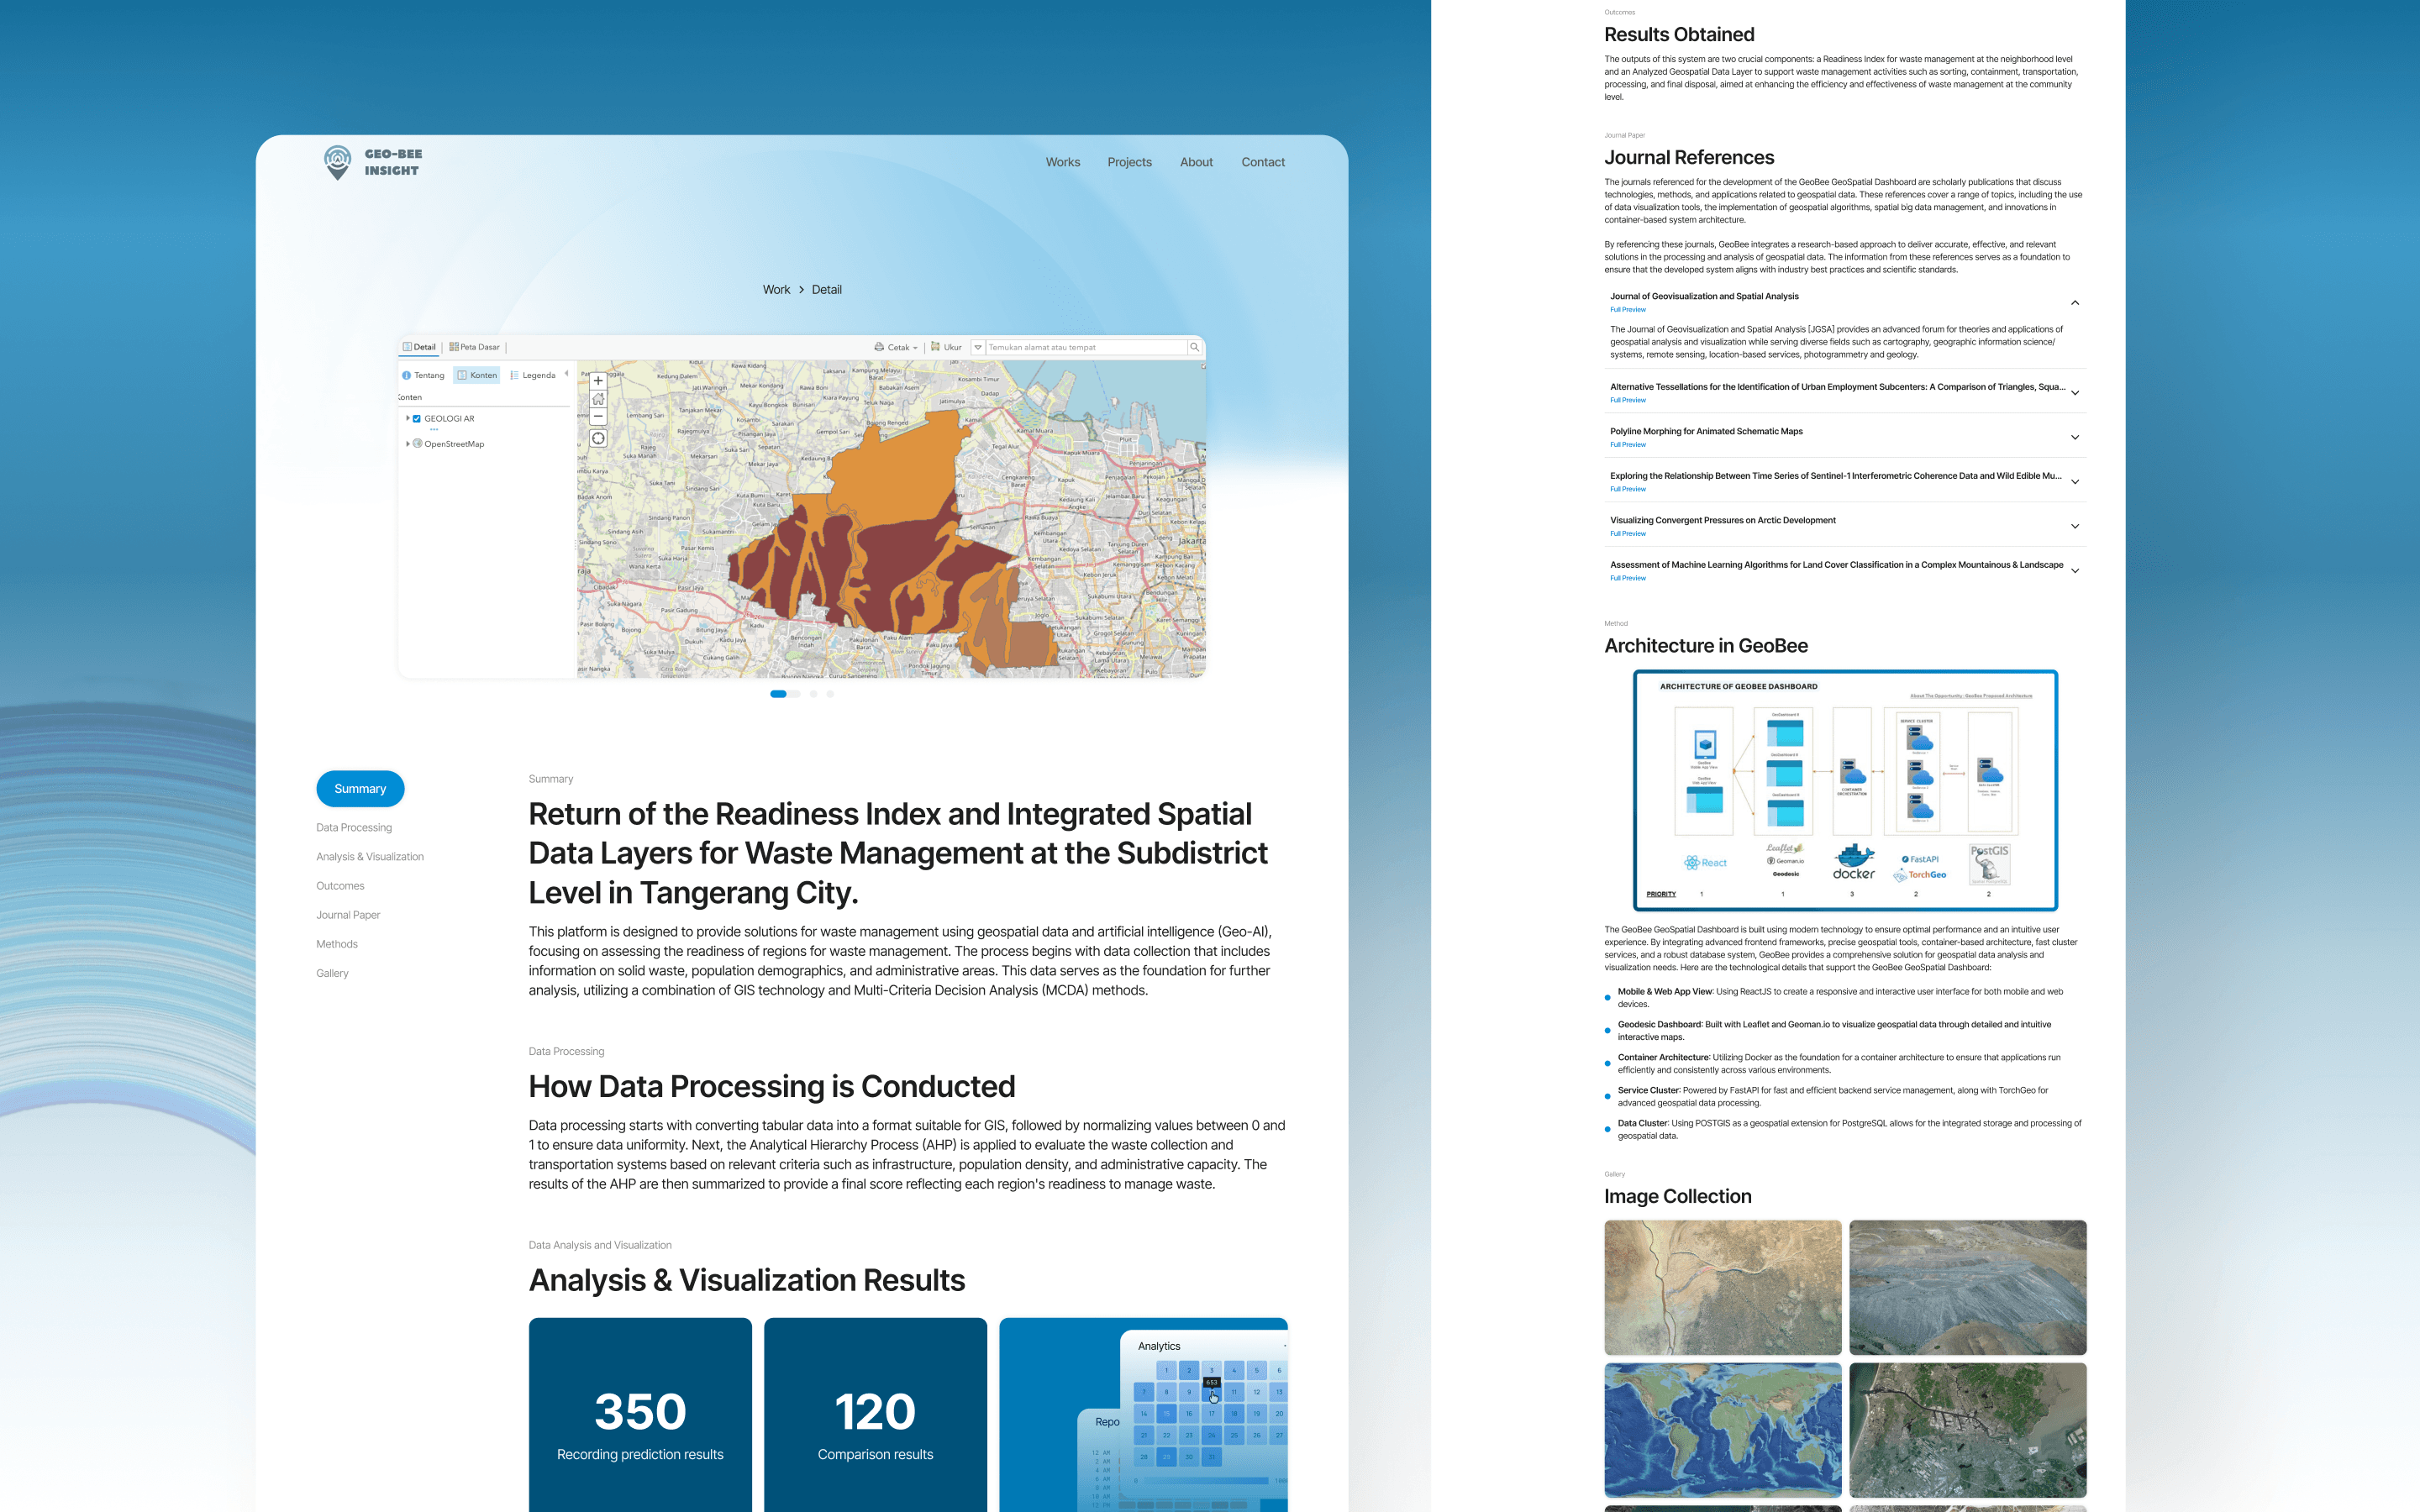
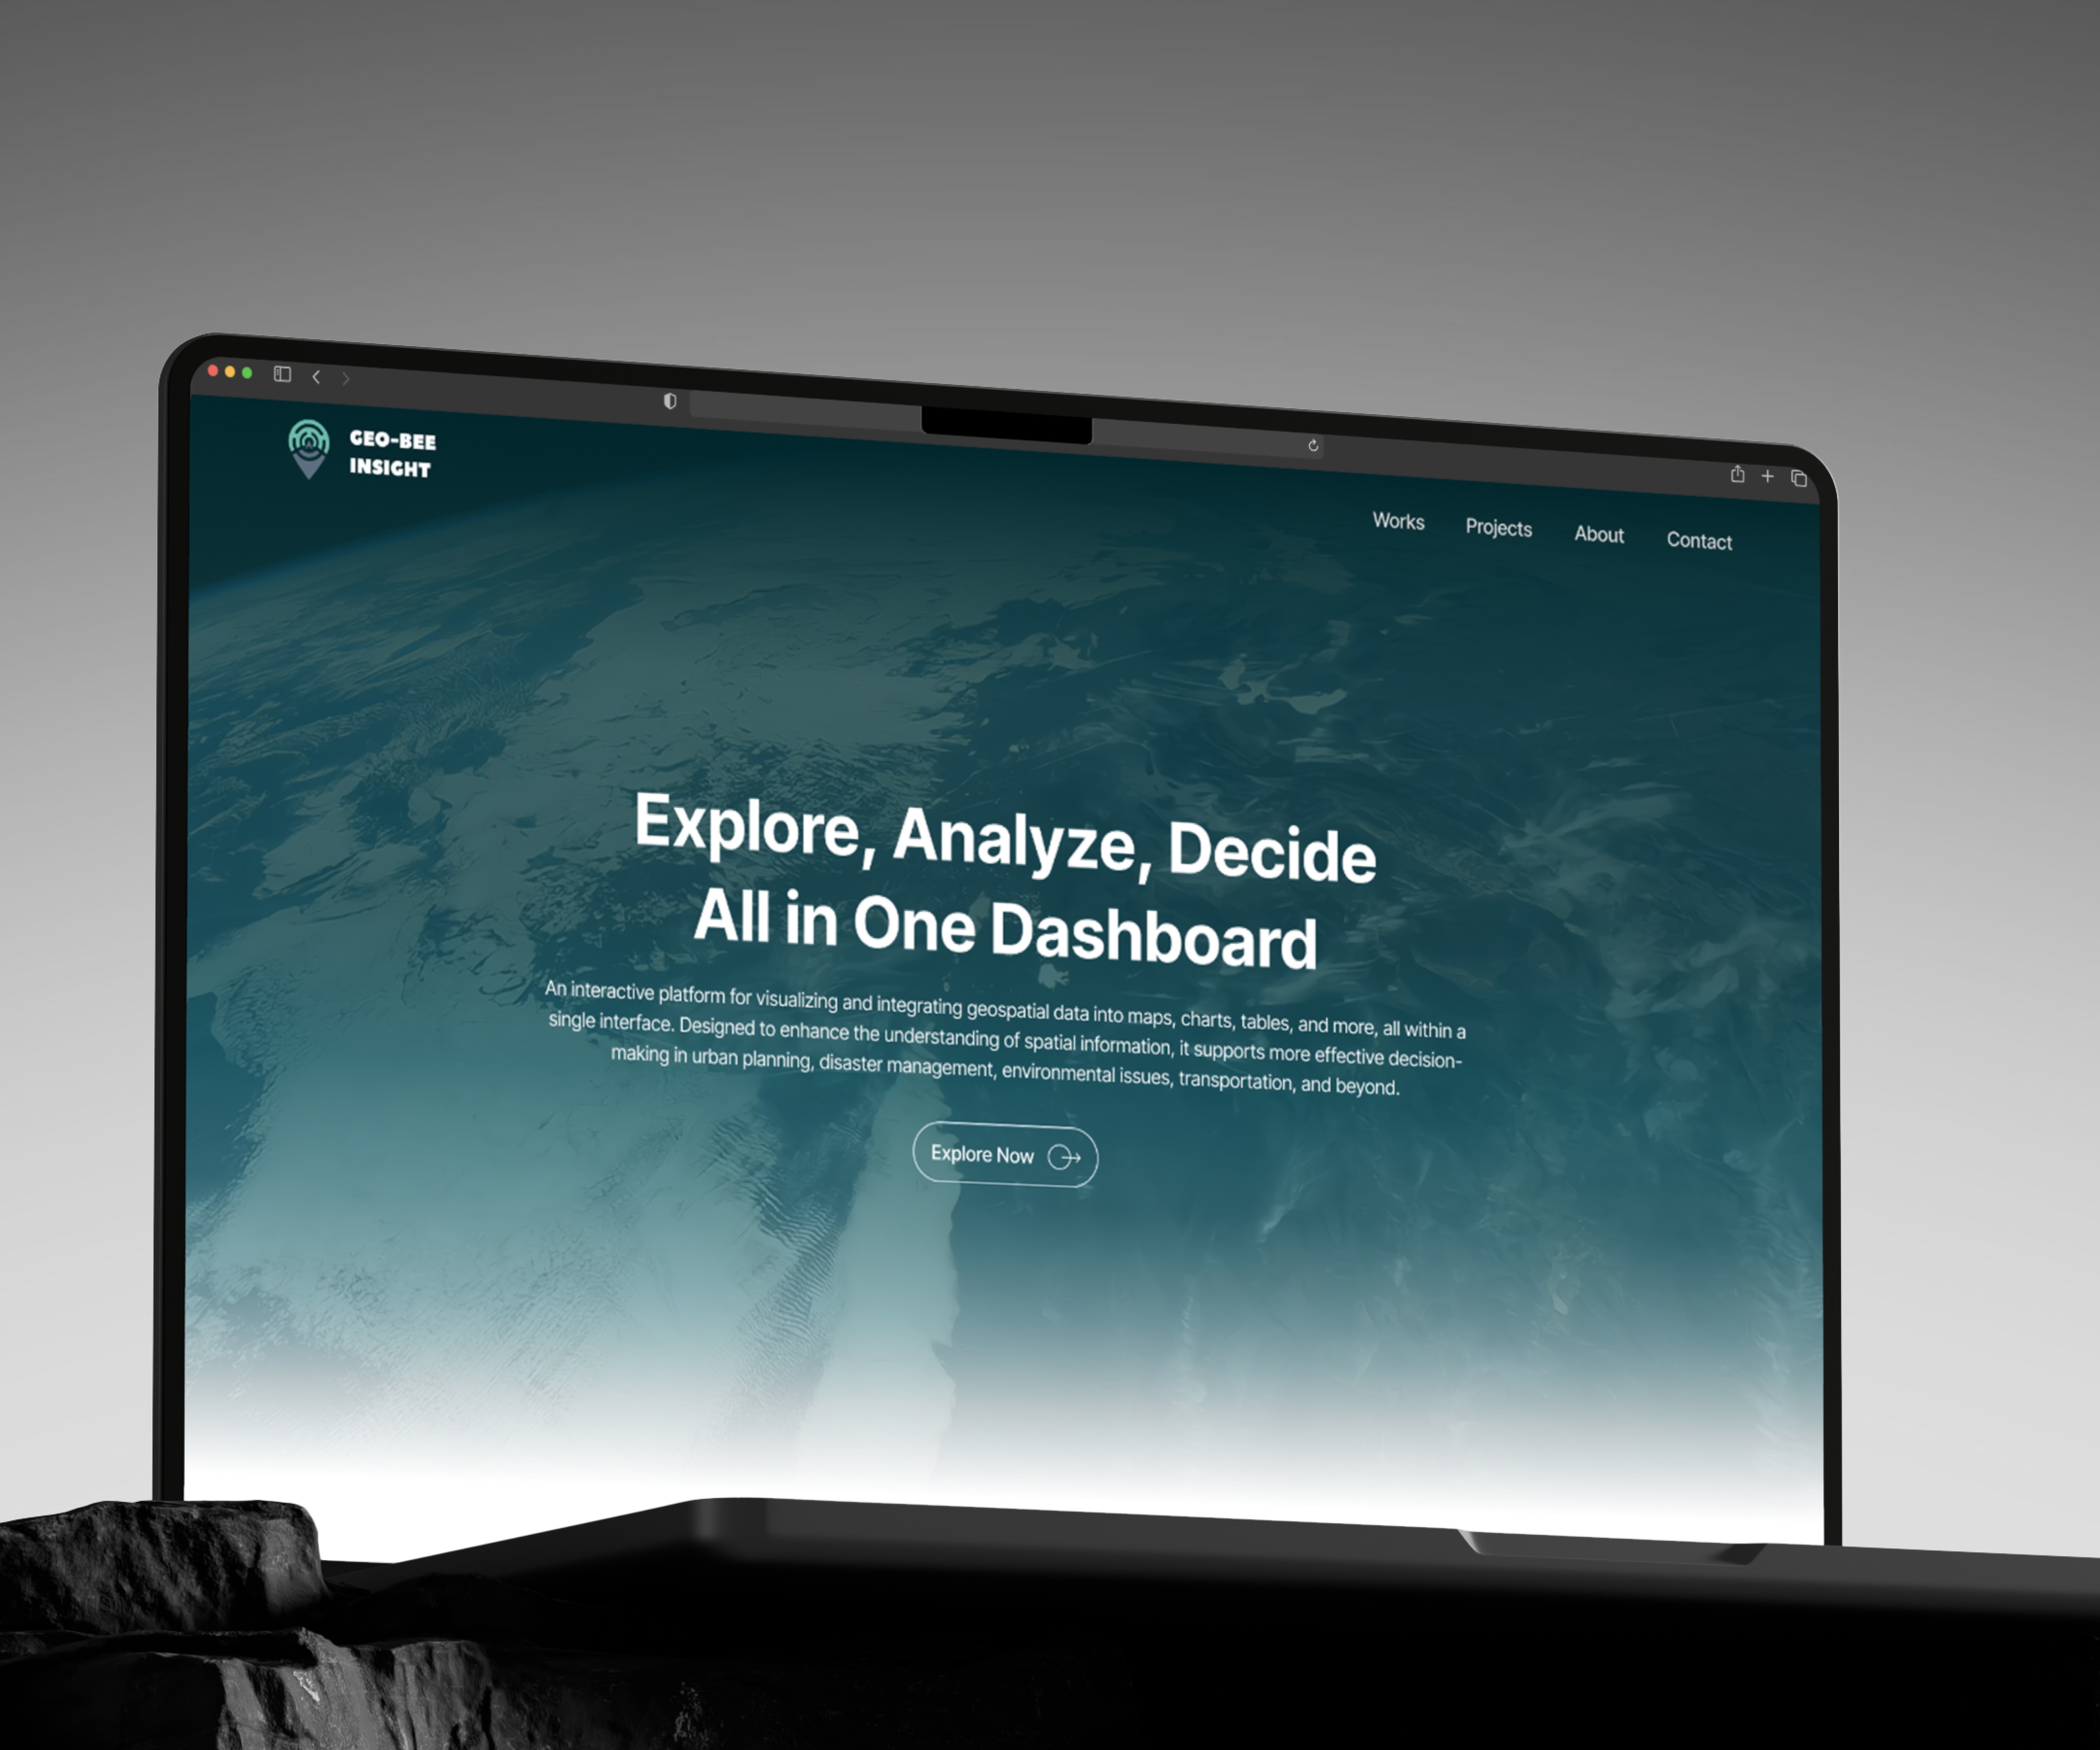
Geo Bee is an interactive geospatial web dashboard designed to analyze environmental changes using integrated geospatial data. This platform enables users to visualize, track, and interpret environmental transformations through an intuitive and data-driven interface.Goals of GeoBee Geospatial is to develop an interactive and intelligent geospatial system that enables users to analyze environmental changes effectively. By integrating multiple geospatial data sources, the platform provides a comprehensive, real-time understanding of environmental patterns, helping researchers, policymakers, and decision-makers make data-driven conclusions. The system is designed to be highly interactive, allowing users to dynamically explore geospatial data, customize their analyses, and extract meaningful insights.
Insights
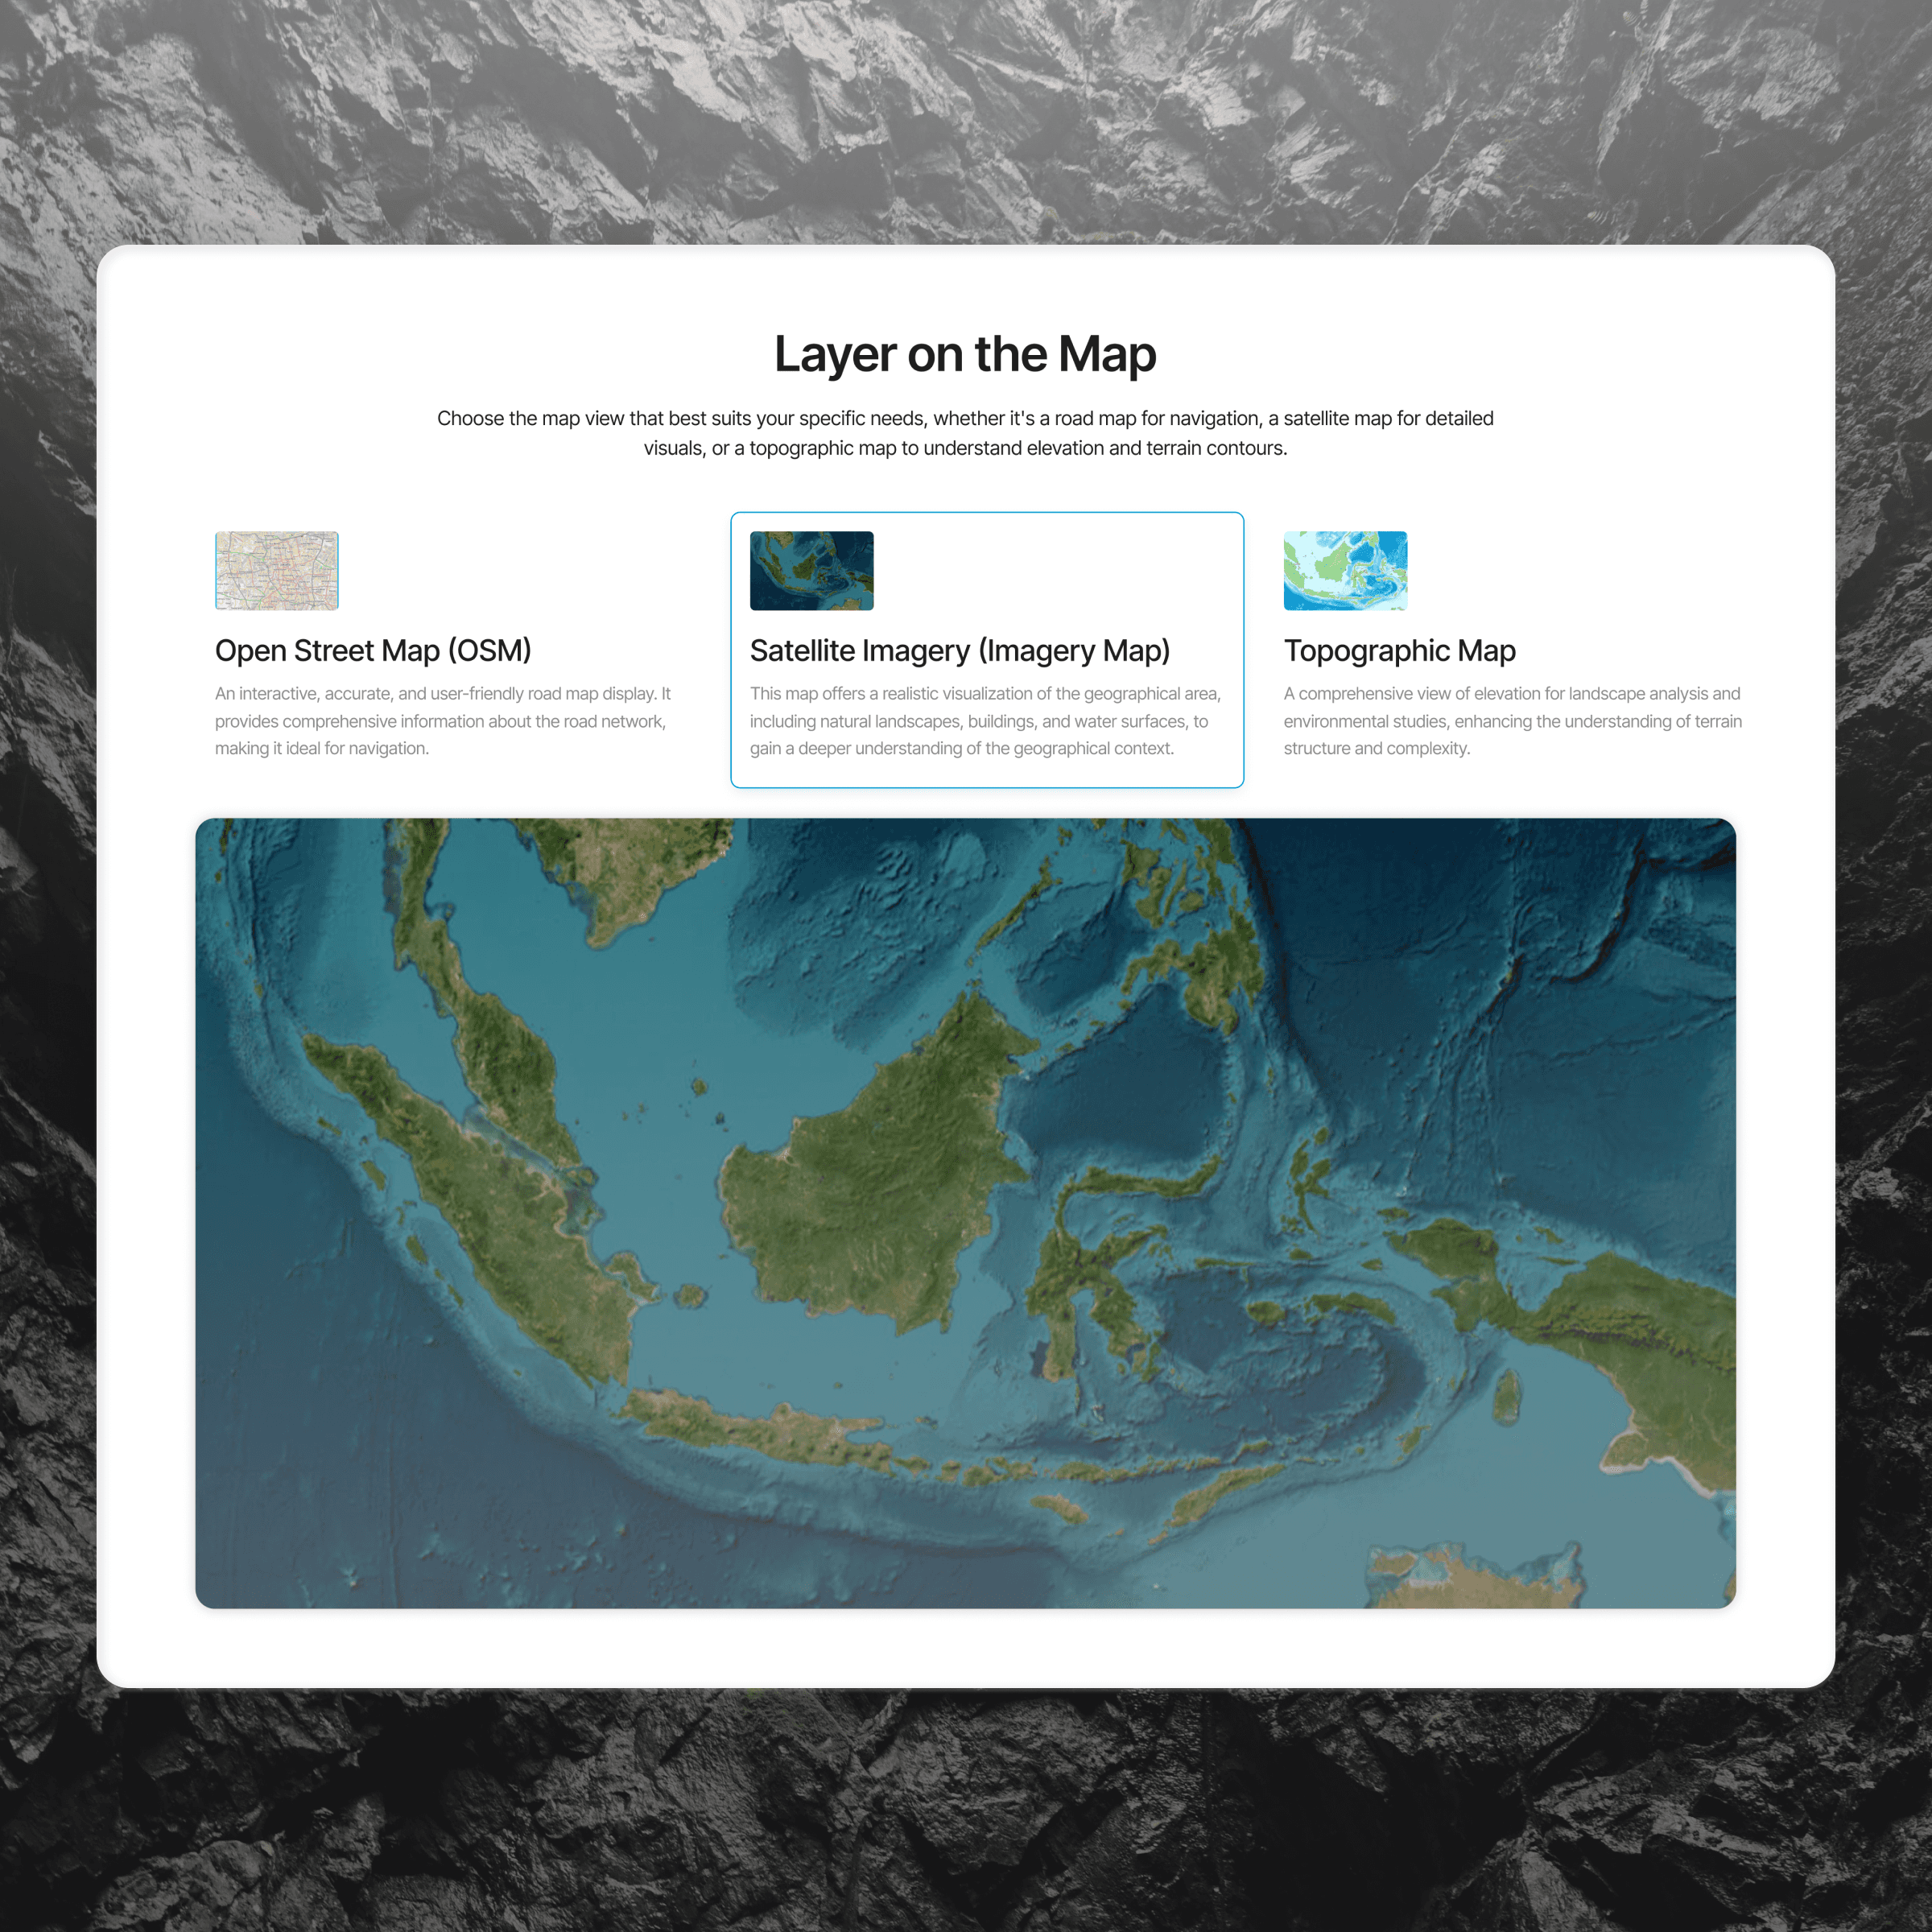
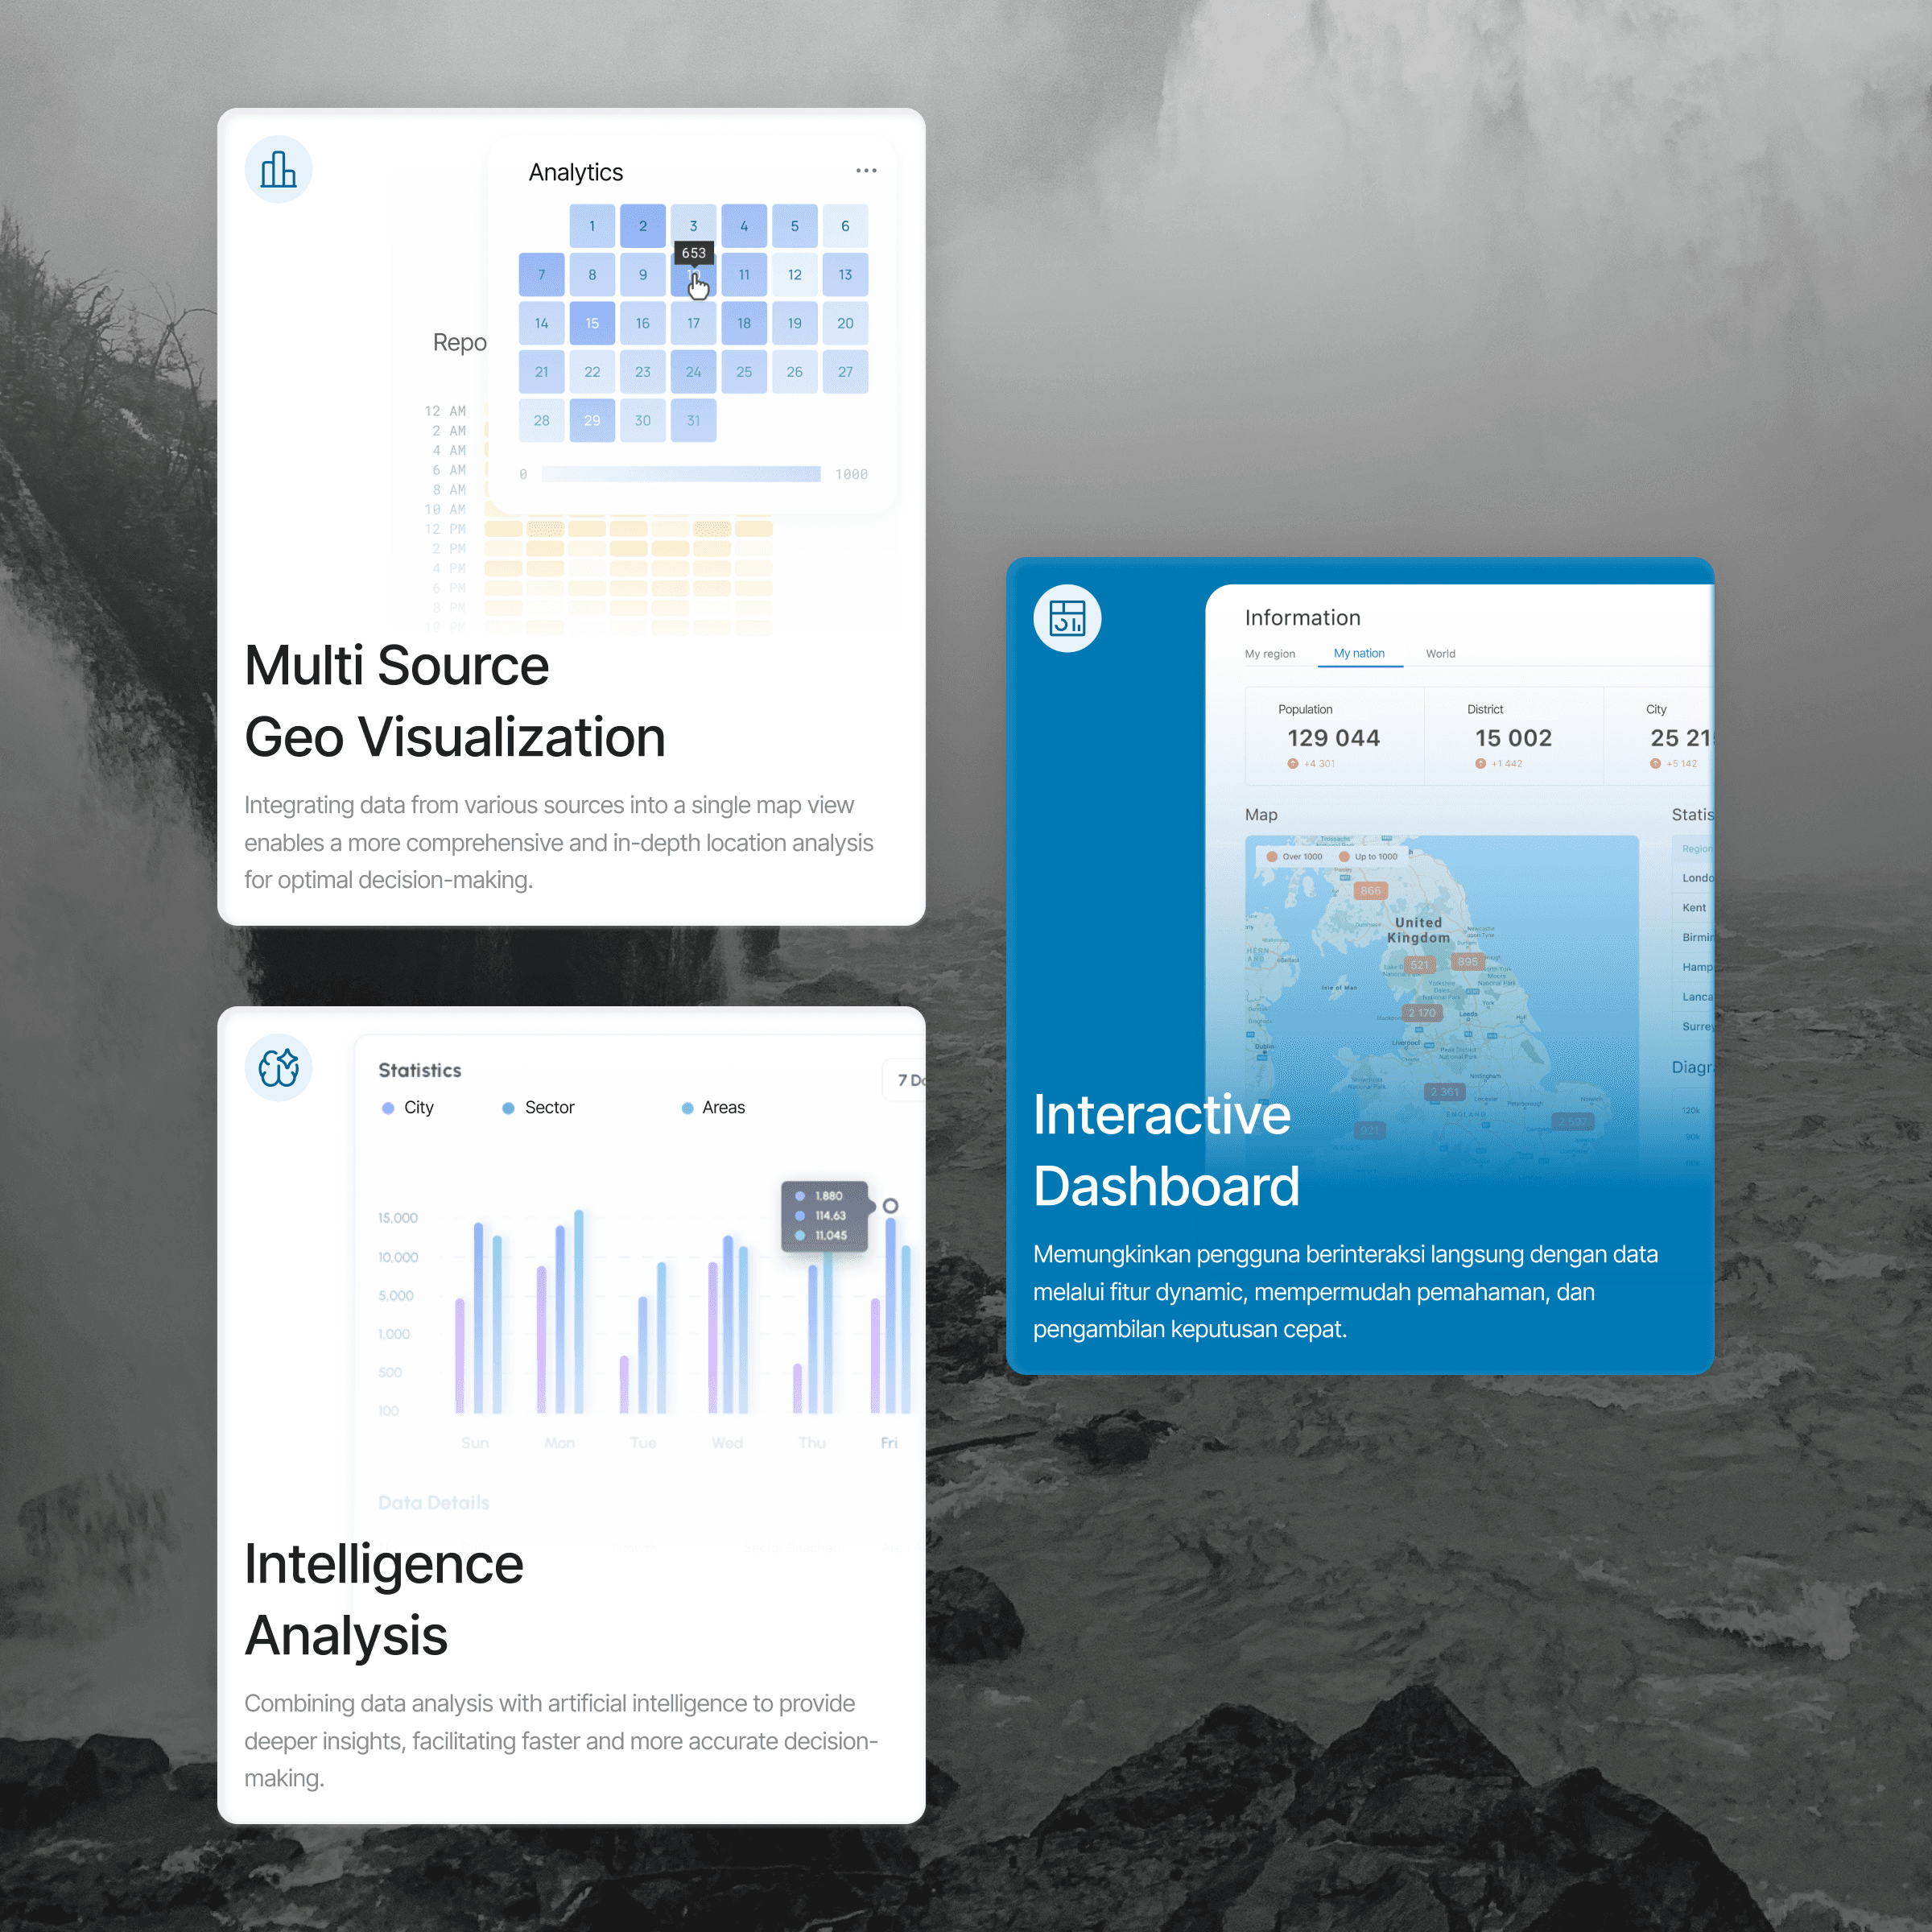
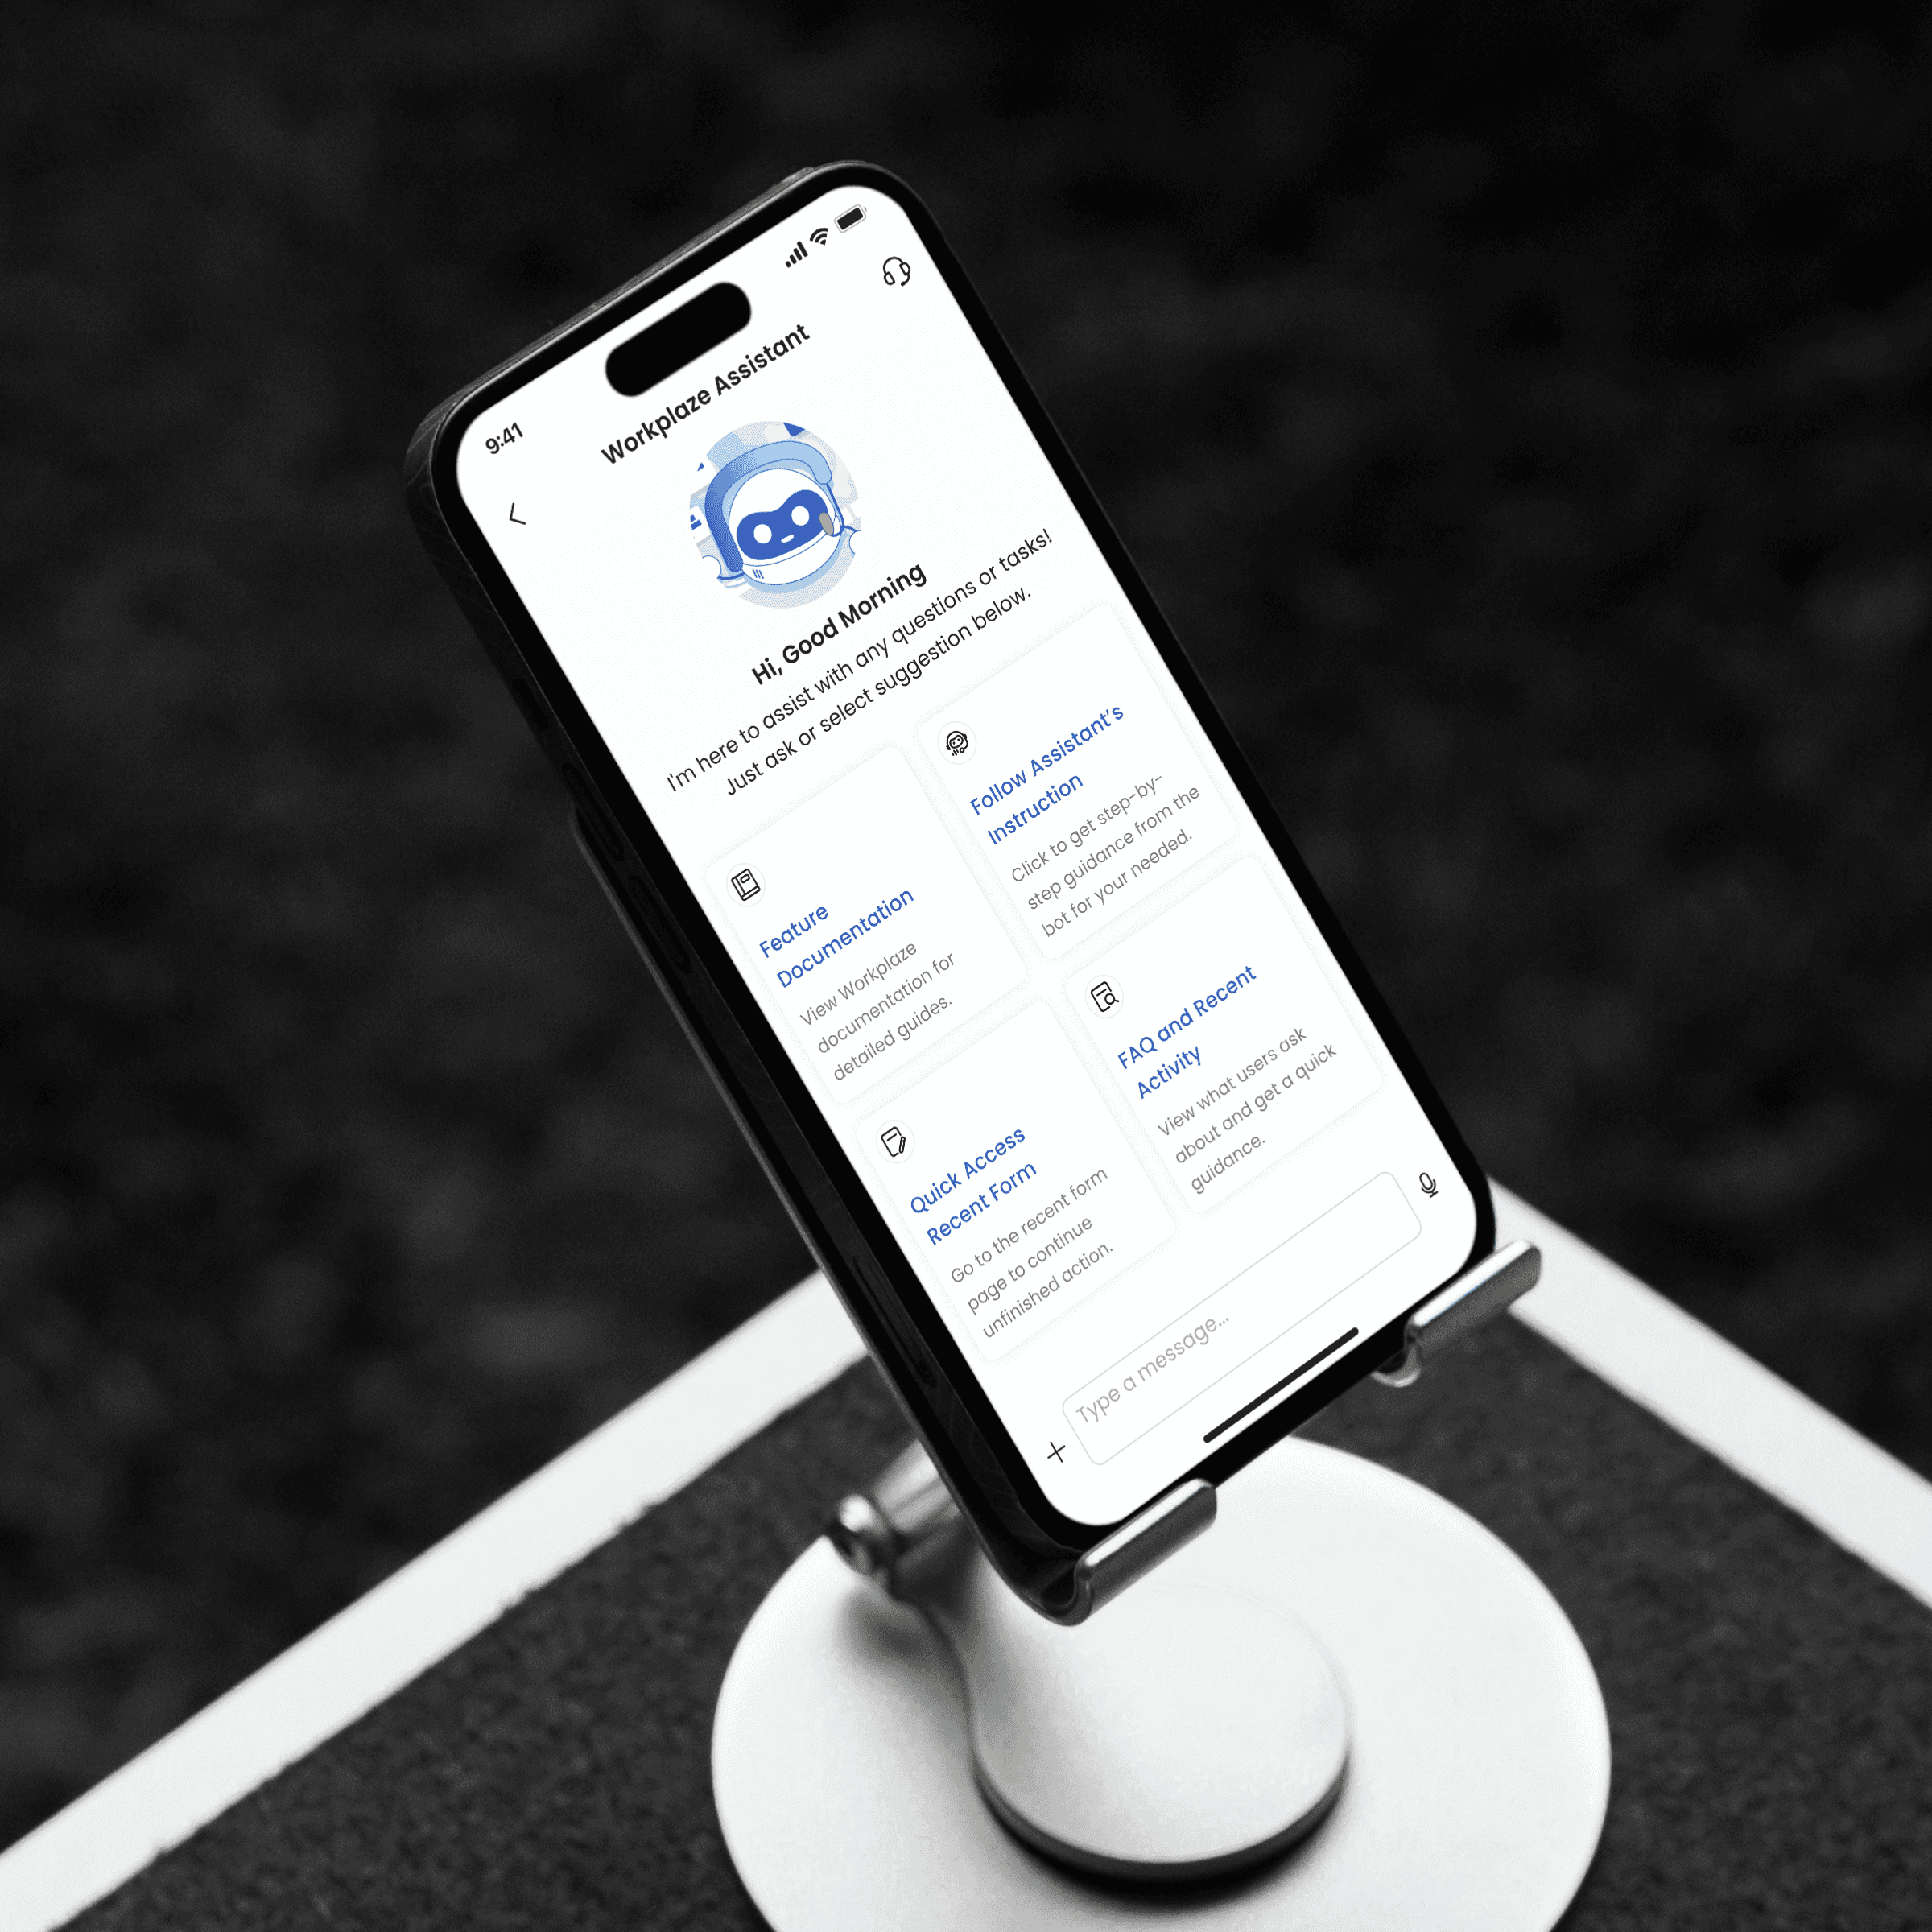
A major focus of this project was to ensure usability and accessibility while handling complex geospatial data. I worked on designing an intuitive interface that balances data complexity with simplicity and clarity, making it easier for users to analyze environmental trends without being overwhelmed.One of the key challenges was optimizing the interactive experience, ensuring that users could seamlessly navigate, filter, and manipulate geospatial data while maintaining performance and responsiveness. By integrating real-time data visualization, advanced mapping capabilities, and predictive analytics, the dashboard provides actionable insights that help users better understand and anticipate environmental changes.This project allowed me to bridge geospatial technology with user-centered design, ensuring that the platform is not only technically powerful but also intuitive and accessible for a wide range of users. The result is a robust and dynamic geospatial tool that transforms raw environmental data into meaningful, interactive analysis, making environmental monitoring more efficient and insightful.
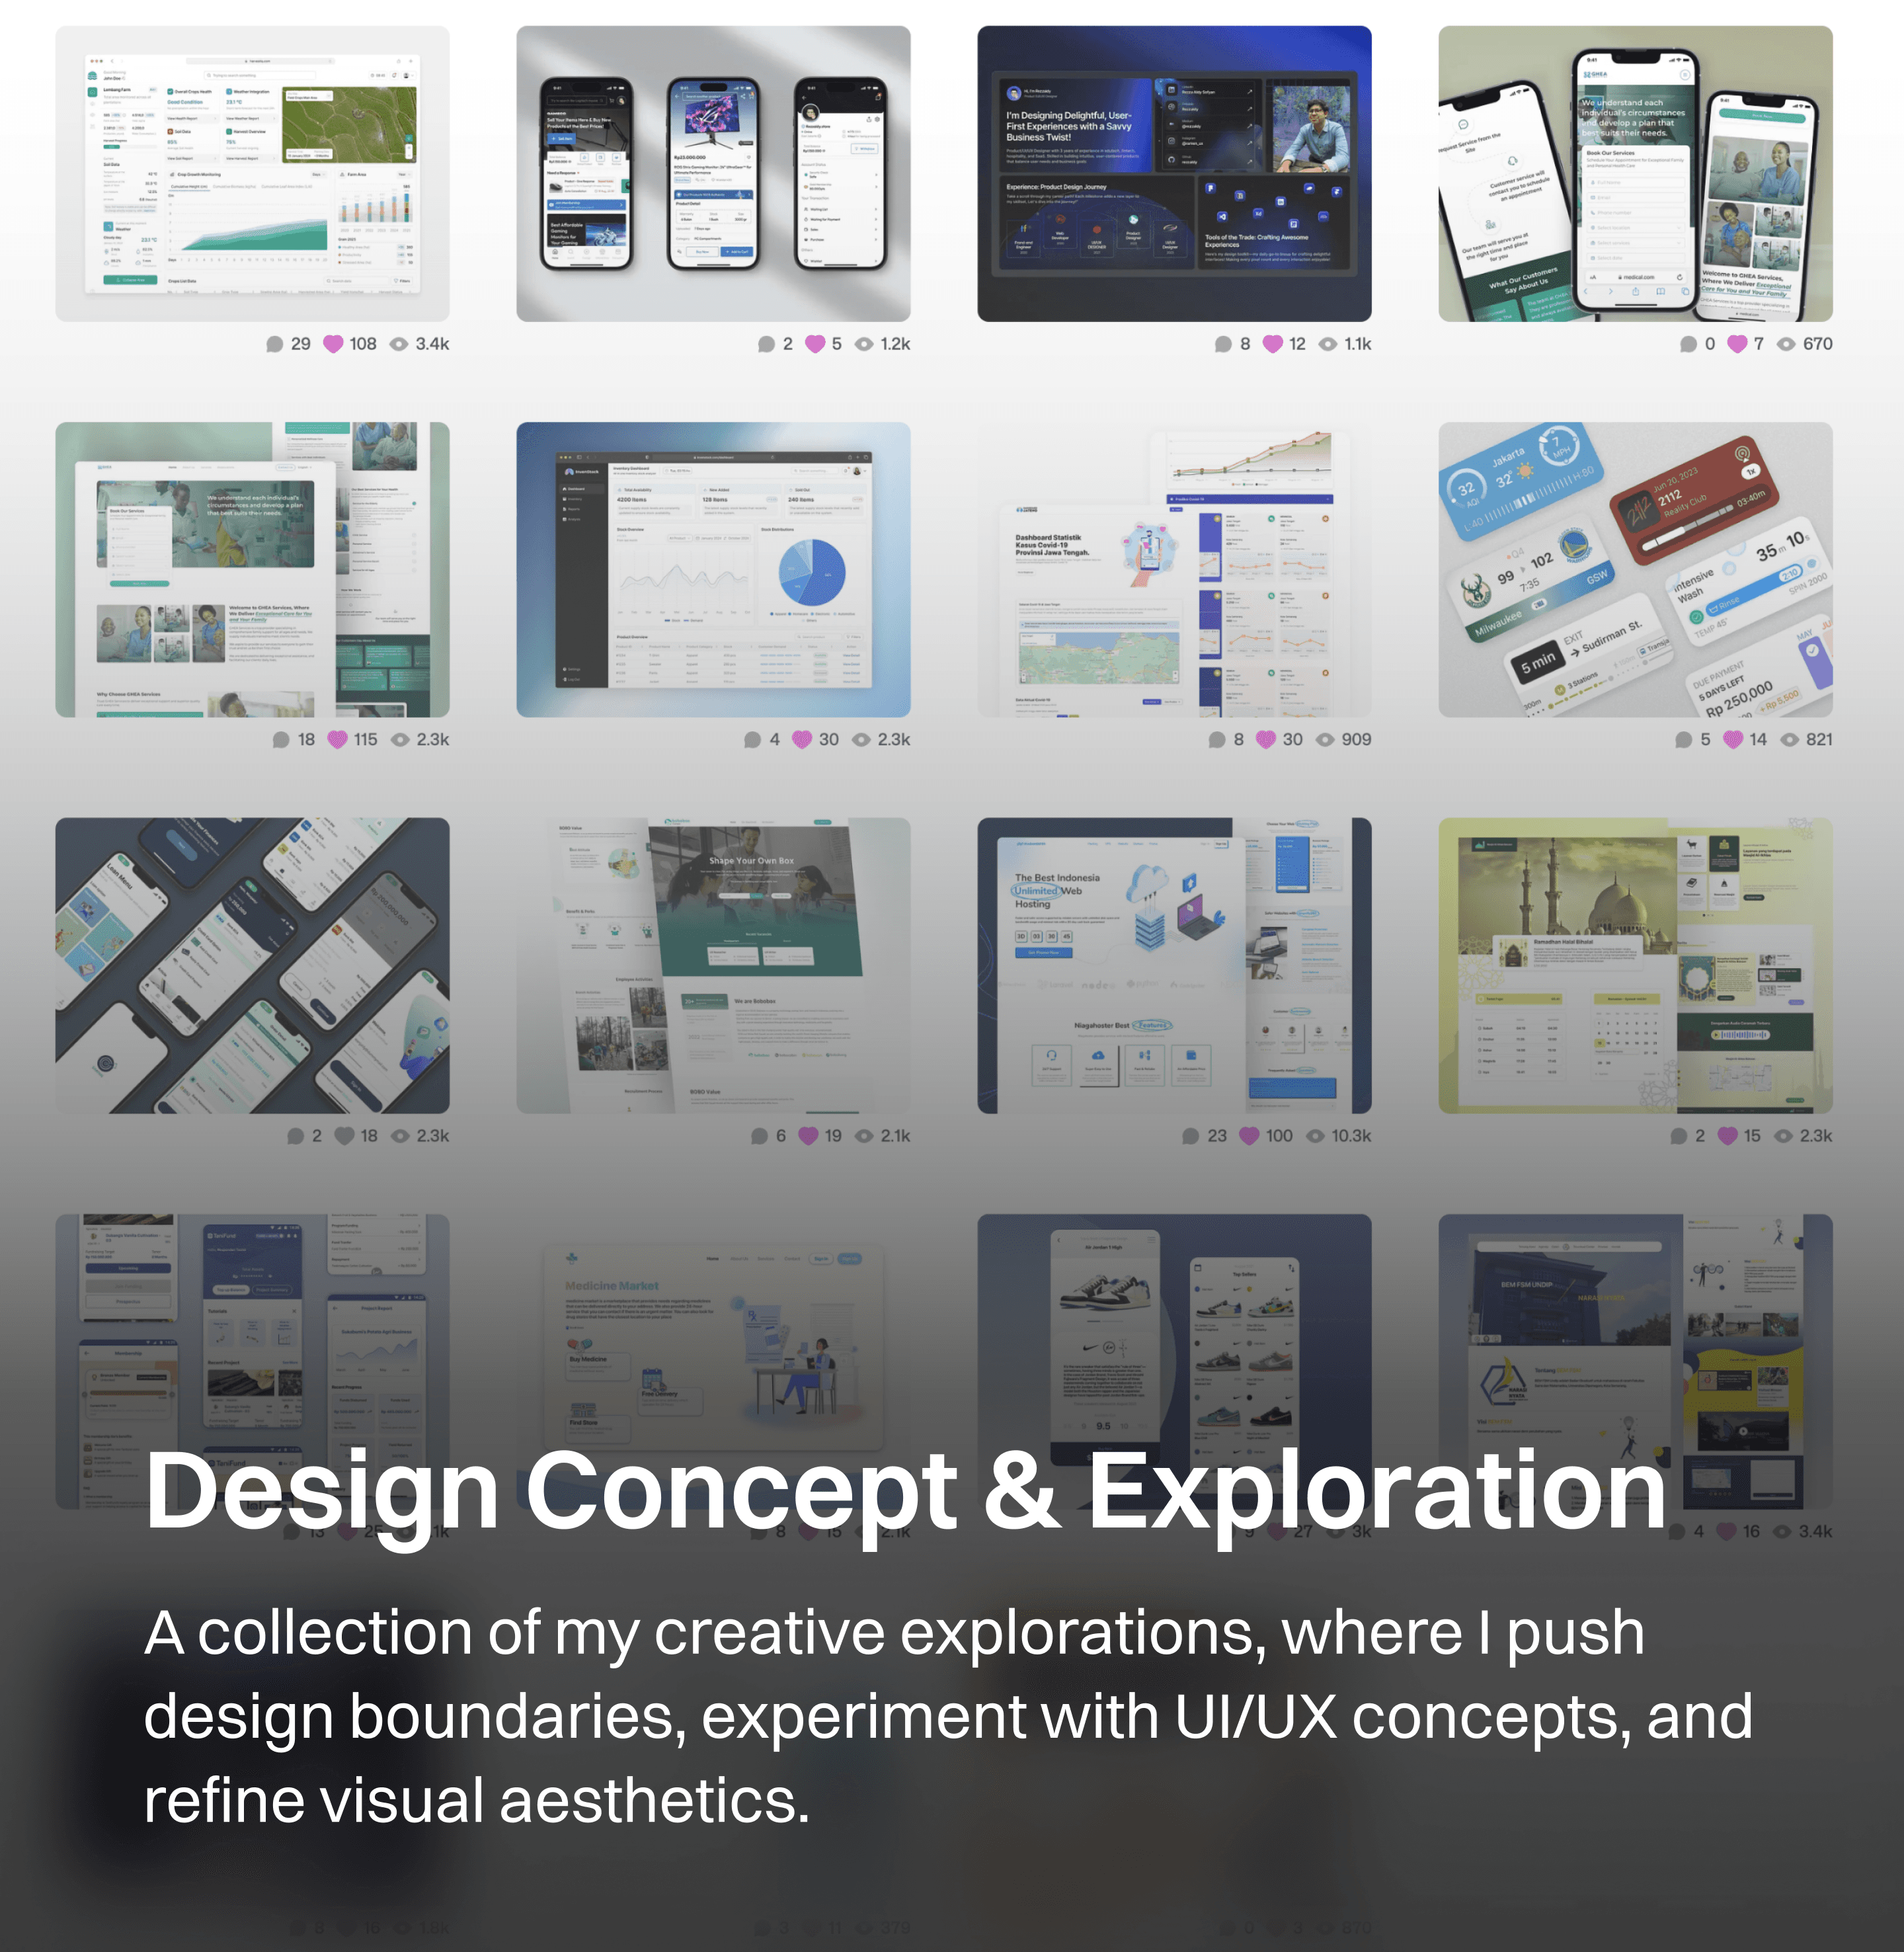
Projects
My other projects


Design systems, guidelines, and stories I shaped with intention.